I have been doing some reading about technical analysis and browsing the net for information. We hear the word recession everywhere. Some people think it is not yet recession whereas others believe it is already here.
What is defined as recession?
According to Investopedia,
"A significant decline in activity spread across the economy, lasting longer than a few months. It is visible in industrial production, employment, real income and wholesale-retail trade. The technical indicator of a recession is two consecutive quarters of negative economic growth as measured by a country's gross domestic product (GDP).
Recession is a normal (albeit unpleasant) part of the business cycle. A recession generally lasts from six to 18 months.
Interest rates usually fall in recessionary times to stimulate the economy by offering cheap rates at which to borrow money."
How has the interest rate changed over time? We can look at the following chart.

There was a stock market meltdown in Asia on January 22, followed by an emergency rate cut of 75 basis points, bringing the interest rate to 3.5%. A week later on the scheduled Fed meeting on January 30, another 50 basis points were cut bringing the interest rate level to 3.0%. Additional data can be found here.
One of the books that I am currently reading (chapter 5, Technical Analysis Explained by Martin Pring) explains how interest rates affect the stock market . The four basic reasons given are:
- Fluctuations in the price charged for credit have a major influence on the level of economic activity and therefore an indirect influence on corporate profits.
- Because interest charges affect the bottom line, changes in the level of rates have a direct influence on corporate profits and therefore the price investors are willing to pay for equities.
- Movements in interest rates alter the relationships between competing financial assets, of which the bond/equity market relationship is the most important.
- A substantial number of stocks are purchased on borrowed money (known as margin debt). Changes in the cost of carrying that debt (that is, the interest rate) influence the desire or ability of investors and speculators to maintain these margined positions. Because changes in interest rates usually lead stock prices, it is important to be able to identify primary trend reversals in the debt market.
Can we forecast a slowdown in economy or recession is coming by looking at numbers related to the interest rate data? It seem we can by observing the trend in the yield curve. First, let's see how yield is explained in investopedia.
"The income return on an investment. This refers to the interest or dividends received from a security and is usually expressed annually as a percentage based on the investment's cost, its current market value or its face value.
This seemingly simple term, without a qualifier, can be rather confusing to investors.
For example, there are two stock dividend yields. If you buy a stock for $30 (cost basis) and its current price and annual dividend is $33 and $1, respectively, the "cost yield" will be 3.3% ($1/$30) and the "current yield" will be 3% ($1/$33).
Bonds have four yields: coupon (the bond interest rate fixed at issuance), current (the bond interest rate as a percentage of the current price of the bond), and yield to maturity (an estimate of what an investor will receive if the bond is held to its maturity date). Non-taxable municipal bonds will have a tax-equivalent (TE) yield determined by the investor's tax bracket.
Mutual fund yields are an annual percentage measure of income (dividends and interest) earned by the fund's portfolio, net of the fund's expenses. In addition, the "SEC yield" is an indicator of the percentage yield on a fund based on a 30-day period."
From investopedia again, the yield curve is explained as follows:
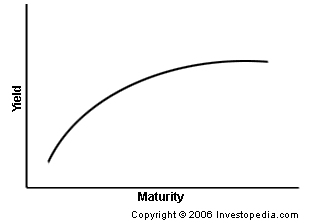
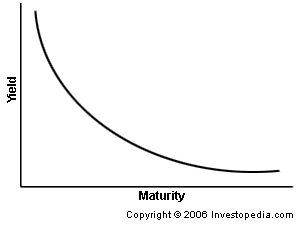
"The shape of the yield curve is closely scrutinized because it helps to give an idea of future interest rate change and economic activity. There are three main types of yield curve shapes: normal, inverted and flat (or humped).
A normal yield curve (pictured here) is one in which longer maturity bonds have a higher yield compared to shorter-term bonds due to the risks associated with time

An inverted yield curve is one in which the shorter-term yields are higher than the longer-term yields, which can be a sign of upcoming recession.
A flat (or humped) yield curve is one in which the shorter- and longer-term yields are very close to each other, which is also a predictor of an economic transition. The slope of the yield curve is also seen as important: the greater the slope, the greater the gap between short- and long-term rates."

"Historically, inversions of the yield curve have preceded many of the U.S. recessions. Due to this historical correlation, the yield curve is often seen as an accurate forecast of the turning points of the business cycle. A recent example is when the U.S. Treasury yield curve inverted in 2000 just before the U.S. equity markets collapsed. An inverse yield curve predicts lower interest rates in the future as longer-term bonds are being demanded, sending the yields down."
There is a very good website with wonderful charting tools for market analysis. In the following figure, the left graph shows the yield curve whereas the right graph shows the S&P500 curve. I have picked years 2000 and 2006 (red, vertical lines on right graph) to see the corresponding yield curves on the left graph. As mentioned previously, we can see that the yield curve is partially inverted in 2000 - the year where the S&P500 curve starts to decline. Similarly, the yield curve is also partially inverted in 2006. Correspondingly, there was a steep decline in S&P500 in mid-2006. However, the market started going up again until early January 2008 where it started going down.
You can go to the stockchart website and use the dynamic yield curve to study its relationship with the S&P500.
Although there is no official word from the government yet, we are most probably in recession already. What do you think? Are we in recession already?
(P.S. aiyo, someone beat me to posting this subject first in seeking alpha blog;)


0 comments:
Post a Comment